Intelligent Time Filter
Analyse your restaurant’s sales by day, week, month or specific time period.
Together with our other tools, you can do an in-depth analysis of your restaurant.
Performance Dashboard
Our dashboard simplifies a huge amount of data into easy-to-understand indicators and graphs.
By specifying the date, you can easily generate your weekly or monthly report and compare them.
Customer Group Analysis
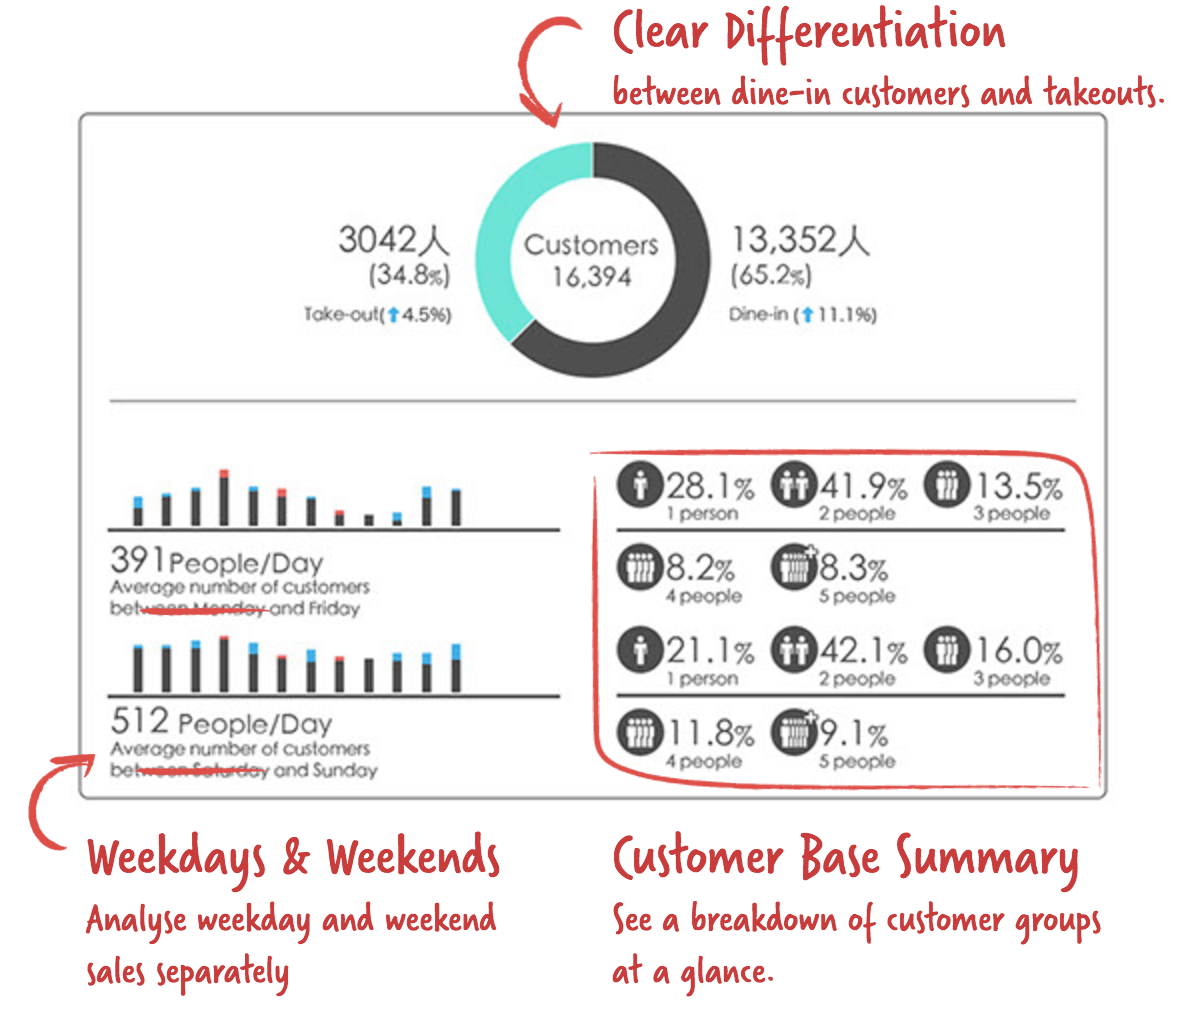
See what kind of crowd your restaurant attracts – the size of the groups they come in – even when you’re not physically there.
You can also analyse the floor’s efficiency for periods with low-sales performance, using the service report.
Promotion & Discount Analysis
Tabulate and summarise the total amount for different type of discounts at a glance and set up various discounts, including staff discounts.
Together with the Intelligent Date Filter function, you can analyse the preferences of specific groups such as couples and larger parties before deciding the best promotion to set for these different groups.
Menu Report
Monitor how well dishes are selling and even see how adjusting the price of one dish could affect other dishes’ sales.
Together with the Intelligent Date Filter function, you can also analyze your takeout performance and see which dishes sell better on certain days.
Order Analysis
Analyse every single dish in detail, such as customers’ taste preferences for that dish, and which dishes tend to get ordered together.
Together with the Intelligent Date Filter, you can also choose specifically to see how well a dish sells, during the lunch or dinner service.
Service Report
You can have peace of mind even if you’re not at the restaurant to monitor your staff. You can now record and monitor how much time they take to do their tasks and how long customers wait for orders.
Together with the Menu Report, you can decide if a slow day was perhaps caused by customers ordering complicated dishes, which resulted in slower delivery time.


